This winter has kept many of us, especially those east of the Mississippi, out of malls and instead hunkered down in our homes. The weather is not the brutal part, though. I have been exposed to a lot more commercials in my hibernation (in part because Hulu doesn’t let you skip them), and I can honestly say that, as a marketing analyst, the link between the agency pitch, the production, and the delivery leaves a lot missing along the way.
There are, of course, those ads that put a lump in your throat and use those heartstrings to cause you to act (or at least put it on your wish list.) These ads that relay a strong emotional bond leading you to act are typically more aware of you than you realize. But then there are the ads that you shake your head at. “What were they thinking?” you may ask as you scratch your head after a GEICO “Museum of Modern Insurance” commercial or GoDaddy Bodybuilder ad. Sure they may be clever, but are they useful? Do they really get the register to ring?
In possibly the first survey of its kind, in 1983, polling firm Louis Harris & Associates asked U.S. adults if they had a personal computer at home and, if so, if they used it to transmit information over telephone lines.2 Just 10% of adults said they had a home computer and, of those, 14% said they used a modem to send and receive information. The resulting estimate was that 1.4% of U.S. adults used the internet.
Personal computer owners were then asked, “Would your being able to send and receive messages from other people…on your own home computer be very useful to you personally?” Some 23% of the computer owners said it would be very useful, 31% said it would be somewhat useful, and 45% of those early computer users said it would not be very useful. And 74% of computer owners agreed with the statement, “The trouble with purchasing and bill-paying by computer is that it will be too easy to buy too many things that aren’t in the family budget.”
Looking back, this should come as no surprise. A blinking cursor on a blank screen was not exactly an invitation to dream, at least by most people’s estimates. The internet would remain a clunky, text-based resource for another six years.
In 1989, Tim Berners-Lee changed all that by introducing the concept of a “distributed hypertext system,” which could link files in an ever-expanding network shaped more like a cobweb than like a chain or tree structure, as was standard at the time. The World Wide Web was born.
Within a year, the Pew Research Center fielded its first question about computer use in a national survey. In February 1990, 42% of U.S. adults said they used a personal computer, even if only rarely. Men and women were about equally as likely to use computers, as were whites and blacks. College graduates were the most likely group to say they use computers on a regular basis: 46%, compared with 16% of those who had completed high school.
But counting the number of computer users was not going to cut it among people who took the internet’s potential seriously.
In 1994, Donna Hoffman and Thomas Novak, professors at the Owen Graduate School of Management at Vanderbilt University, wrote, “Current approaches to estimating the number of users of the internet are akin to estimating the number of people in the U.S. by sampling the number of buildings, without regard to their function or contents. We propose a completely different way—rather than inferring the number of users by counting and sampling machines, sample the users themselves.”3
The computer connection
In 1995, the Pew Research Center did just that, finding 14% of U.S. adults with internet access.4 Most were using slow, dial-up modem connections—just 2% of internet users were comparatively screaming along with an expensive 28.8 modem.
To put things into further perspective, 42% of U.S. adults had never heard of the internet and an additional 21% were vague on the concept—they knew it had something to do with computers and that was about it. Yet even then, 63% of people who used a computer at home said they would miss it “a lot” if they no longer had one.
Early researchers were not too far off the mark, however, focusing on computer penetration into American households, schools, and businesses. Twenty-five years ago, anyone who wanted to use the internet needed to have access to a computer. Again, in 1990, 42% of U.S. adults said they used a computer at their workplace, at school, at home, or anywhere else, even if only occasionally.
Now, eight in ten U.S. adults (81%) say they use laptop and desktop computers somewhere in their lives—at home, work, school, or someplace else.
Education has always been a significant factor when it comes to predicting someone’s likelihood to use a computer. In both the 1990 and the current sample, there is about a 30 percentage point gap in computer use between adults with a college degree and adults with a high school diploma. Age is also a durable predictor for computer use: 56% of adults ages 65 and older now say they use a computer, compared with 89% of 18-29 year olds, for example.
Cell phones and mobile connectivity
Nowadays, desktop or laptop computer access is no longer a prerequisite for internet access. Ninety percent of U.S. adults have a cell phone and two-thirds of those say they use their phones to go online. One third of cell phone owners say that their primary internet access point is their phone, not some other device such as a desktop or laptop computer.
The Pew Research Center’s earliest measure of cell phone ownership was in 2000, when 53% of U.S. adults said they had a cell phone.
Education is less of a factor in predicting cell phone ownership than in predicting computer use: 93% of adults with a college degree have a cell phone, compared with 87% of adults with a high school education or less. Age, however, is a factor: 98% of 18-29 year-olds say they have a cell phone, compared with 74% of adults ages 65 and older.
Mobile access to the internet took a huge leap forward when smartphones were introduced in mid-2007 with the introduction of the iPhone. Now, 58% of U.S. adults say they have a smartphone. Higher education is associated with smartphone use, as is being younger than age 50.
Internet adoption over time
Adding all of these access points together, 87% of U.S. adults say they use the internet, at least occasionally—the highest percentage captured in a Pew Research Center poll since we began measuring it in 1995, when just 14% of U.S. adults had access.
The latest findings illustrate remarkable growth in internet adoption across all demographic groups. Yet, there still are notable differences in adoption: Those ages 65 and older are considerably less likely to use the internet than younger Americans; those with college degrees are more likely than those with high school diplomas or no high school diploma to be online; and those in higher-income households are more likely to be online than less well-off Americans. More Pew Research material on digital differences can be found here.
Another way to look at the increasing importance of the internet is to look at the frequency with which people go online. Seventy-one percent of all American adults say they use the internet on a typical day. This is a significant increase from the year 2000, our first measure, when just 29% all adults said they went online on a typical day.
The vast majority of internet users go online from home on a typical day—90% say that, up from 76% in 2000. The percentage of internet users who go online from work has not changed as much in the past 15 years: 44% of internet users say they go online from work on a typical day in 2014, compared with 41% of internet users who said that in 2000.
The rise of mobile device use represents the biggest shift in access over the past ten years: 68% of U.S. adults now say they access the internet on a cell phone, tablet, or other mobile device, at least occasionally.
All of this data covers the mechanics of the internet’s spread— the how of access—but it doesn’t address why people flocked online.
Is it because they could access a seemingly limitless amount of information? Is it because they could communicate, in real time, with friends and family across the globe? Is it because they could share their deep expertise in a subject? Is it because they really liked that cute boy and wanted to know if he is single? Like the parable of the blind men describing an elephant—one feels the leg and says it is like a pillar, another feels the tail and says it is like a rope—people’s experiences of the internet are highly subjective. Instead of guessing at why people were drawn to it, or were required to start using it, we asked people to assess the role of the internet in their lives more generally.
Survey by Southern New England Telephone. Methodology: Conducted by Louis Harris & Associates, September 1-September 11, 1983 and based on telephone interviews with a national adult sample of 1,256. Data provided by The Roper Center for Public Opinion Research, University of Connecticut. ↩
Social media is a crowded place. You need every competitive advantage possible to stand out.
Luckily, giving your social media posts a little something extra doesn’t have to mean to a lot of extra work for you.
In this post, we’ll go over some simple tricks and best practices of social media formatting to help you create unique, stand-out posts on Twitter, Facebook, Google+, LinkedIn and Pinterest, along with some tools to help you create memorable blog tidbits worth sharing.
Let’s get started!
Stand out on Twitter
Offering just 140 characters and a very short shelf life, Twitter may be the most challenging medium to stand out on.
Here are a few ways to make the most of your tweets.
Symbols and emoticons
Adding symbols like ♥✩♬♡►♪☺♫ to your tweets isn’t just fun – it can also make your tweets shorter and easier to read. The Wall Street Journal even uses Twitter symbols to add bar charts to its tweets.
Tweets get more traction when there’s a little room to spare – shoot for 120-130 characters.
Add value with photos
Buffer’s research on Twitter posts with photos versus without indicates that photo posts vastly outperform non-photo posts in terms of both clicks and shares. Tweets with images received 18% more clicks, 89% more favorites and 150% more retweets.
And according to HubSpot research, photo posts bring in 55% more leads, as well.
Stand out on Facebook
With Facebook’s recent algorithm changes meaning less exposure for brands, most of us can use all the help we can get making posts stand out here. Here are some tactics to try.
Creative emoticons
They’re not always so professional, but they sure are fun. Emoticons can spice up a status update – here’s a list from Jess3 of some popular ones and how to make them.
Contrary to the footnote at the bottom of the graphic, these images actually do work in status updates – even for brand pages.
Shorter is better
BlitzLocal looked at close to 120 billion Facebook impressions and discovered some interesting facts about lengths of posts. The researchers concluded:
“Longer posts tend to perform poorly. The ideal interaction being driven by posts is between 100 to 119 characters. Questions tend to drive interaction up by 10 to 20 percent.”
Pin posts
For crucial info, current offers or simply a post you really want to be seen, try pinning. A pinned post is an update that you manually select to stay at the top of your Timeline even as you add other posts to your page.
Highlight posts
A similar option is highlighting. A highlighted post expands across your page, taking up both columns. Highlight a horizontal photo to draw attention to it on your page.
Edit headline and summary text
One of the greatest things about posting to Facebook is how many of the fields are totally customizable. Use this flexibility to highlight the most shareable elements of your content.
Pro tip: You can do all of this if you’re Buffering a post to Facebook, too (and gets lots more photo thumbnail choices)!
Size photos correctly
Because Facebook will automatically resize images that don’t match its specifications, size and aspect ratio of photos are super important.
The aspect ratio is very specific: image widths need to be 1.91 times the height. This will mean the image scales perfectly in both the desktop News Feed and on mobile.
Images are now larger when shown in the News Feed, so keeping the aspect ratio right will make sure your images look great wherever the user sees them.
Recommended image sizes have also changed for Facebook’s desktop News Feed and mobile views. For the News Feed, Facebook recommends thumbnail images of 400×209 pixels. Images that are smaller than these dimensions will be resized to either 154×154 or 90×90 pixels.
On mobile, Facebook’s recommended image size is 560×292. Images smaller than this will be resized to 100×100 pixels.
This handy graphic from Jon Loomer shows the right sizes:
Stand out on Google+
Google+ offers some very specific elements different from other social networks that can help you stand out. Here’s a guide to them.
Prioritize rich visuals
A quick glance over at Google+ will show you that it’s an incredibly visual social network.
Make the most of this by posting useful, interesting or engaging images at full size (not the thumbnail that comes with a link) like so:
The network also takes some posts and gives them priority placement in a user’s feed.
How can you make that your post? According to Google, “a variety of factors determine what becomes an enhanced post in your stream but we try to surface content and people that we think you wouldn’t want to miss.”
But you can up your chances by posing lots of high-resolution photos and video.
How can you create useful, instructive or fun GIFs for your audience? Learn how to make your own with this Mashable tutorial.
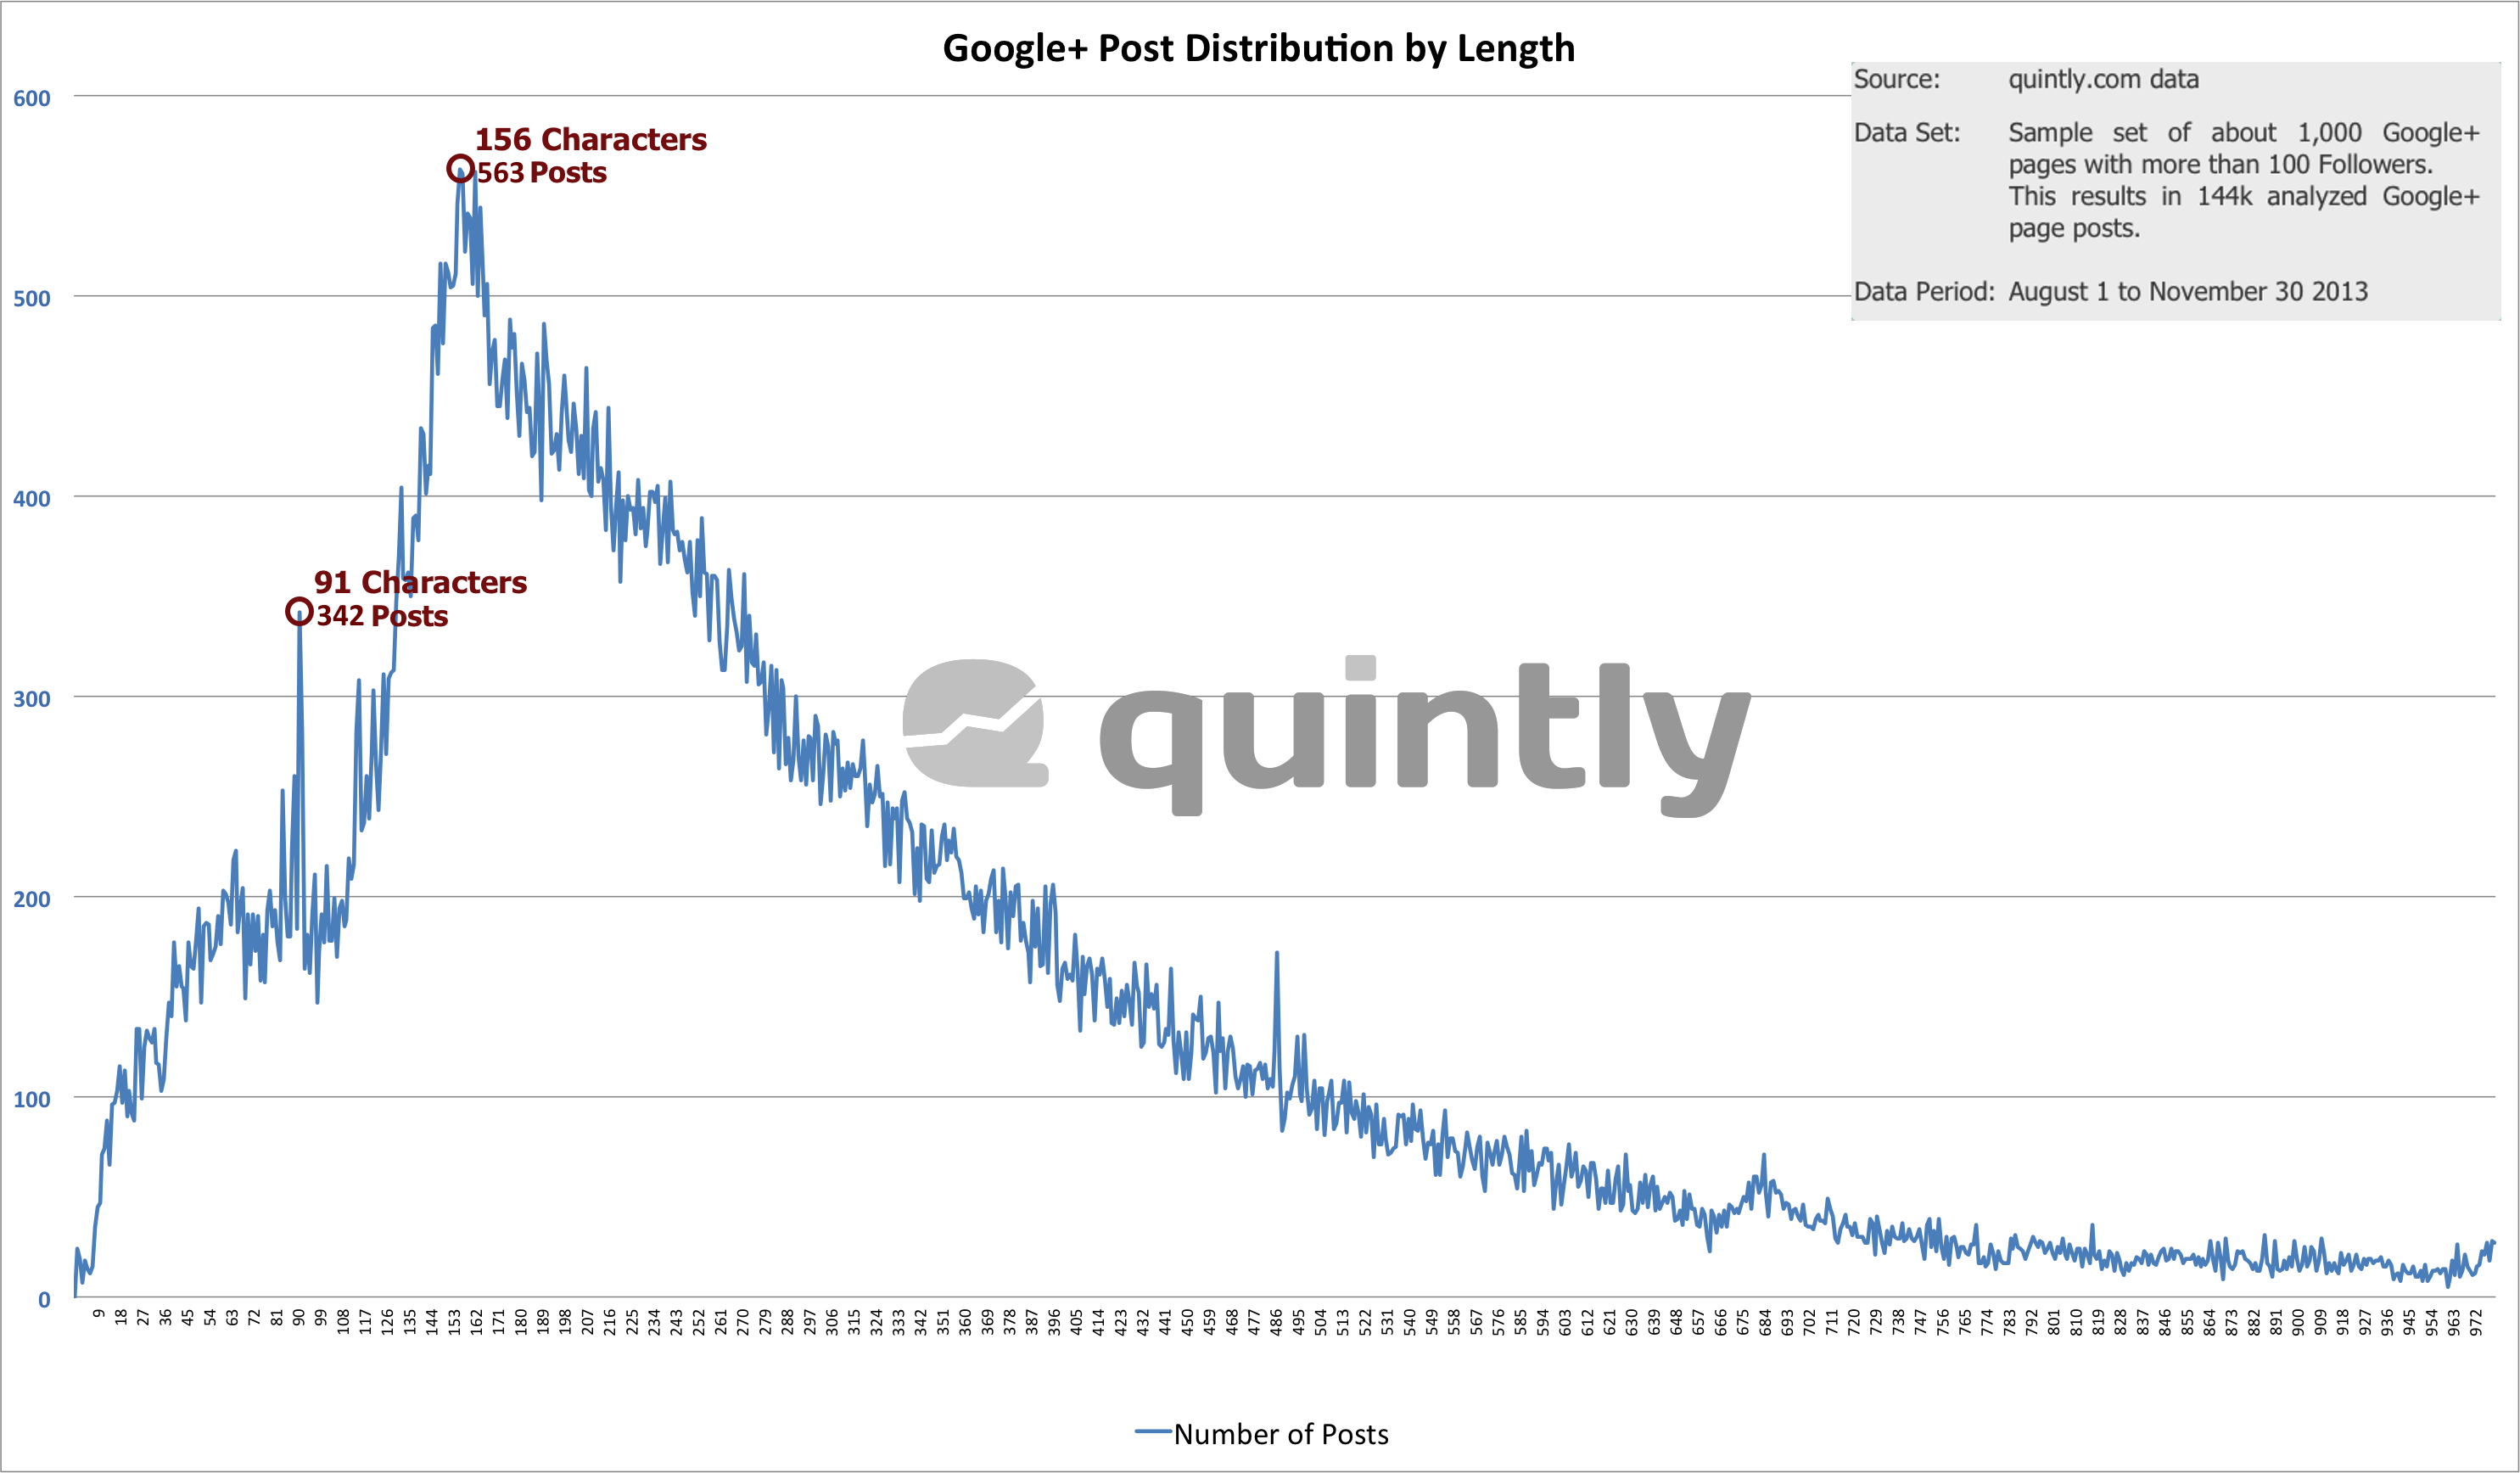
Slightly longer posts
Research by Quintly shows that the average Google+ post peaks at 156 characters, or 2-3 sentences.
This is in line with the general philosophy of Google+ as a place for more in-depth, thoughtful discussions. (Google+ allows you to share up to 100,000 characters.)
Take advantage of the extra space to explain a concept, pull out a stat or otherwise provide a valuable tidbit to pull the reader in.
Format for better readability
Google+ also offers more formatting options than the other social networks, including the ability to bold, italicize and strikethrough. Use these options to create headlines and more for your posts so they’re easier for readers (and Google!) to discover.
LinkedIn provides multiple posting opportunities, including from a personal page and from a company page (P.S. You can do BOTH from Buffer!). We’ll touch on both with a few stand-out tips.
Post often
This first step might seem a bit obvious, but many people still think of LinkedIn as a place to keep up your professional resume when in fact frequent sharing can make a big difference.
According to LinkedIn research, users who share articles or content with their LinkedIn network at least once a week are nearly 10 times more likely to be contacted by a recruiter for new opportunities than people who don’t share with their network.
As with Facebook, aspect ratio is important when posting a photo to LinkedIn. Photos within a post will be resized to 180 x 110, so start with that width to height aspect in order to make sure your image looks its best.
And much like Facebook, most fields of a post are customizable, so make them network-specific and catchy!
Pro tip: You can change any of the fields in Buffer for LinkedIn, too!
Company posts also have an additional option to upload a custom photo different that one of the options LinkedIn automatically pulls in.
LinkedIn works well with most photos, but be careful when posting long visuals like infographics. Often it can be better for readability to take a screenshot of a portion for your update instead of posting the whole thing.
Max out company page visual real estate
For a LinkedIn company page, there are a lot of opportunities for great visuals.
For Pinterest, we’ll focus on image size and type to help your pins stand out.
Employ rich pins
If you haven’t already, be sure to explore rich pins, a way of adding additional, useful info to pins. Types include:
Article pins, which include the headline, author, story description and link
Product pins, which include real-time pricing, availability and where to buy
Recipe pins, which include ingredients, cooking times and serving info
Movie pins, which include ratings, cast members and reviews
Place pins, which include an address, phone number and map
Use taller images for more repins
Social media scientist Dan Zarrella researched what works best on Pinterest and found that the taller an image is, the more likely it is to be repinned:
Try animated GIFs
It hasn’t been too long ago that Pinterest added animated GIFs as a new option, so there’s still time to stand out with these – as this attention-grabbing image shows.
Make your blog post stand out
Add more shareable elements into any blog post with these tools and tricks.
Make facts and stats quickly tweetable
If you work in marketing, chances are you’ve seen HubSpot’s blog posts shared a lot. One cool way they accomplish that is by making it easy to share stats as seen below.
You can employ this tactic, too. Use a tool like Click to Tweet to create pre-populated tweets with the message you want to be shared. Here’s how it works:
Viewers can engage with embedded posts by following users, liking or commenting on posts and watching video posts.
Even better: Those who don’t already like or follow you will have the option to do so without leaving the page, meaning embedded posts can potentially help boost your fan count across social networks.
Here is a recent Buffer Facebook post embedded for you:
Visuals like quote photos and infographics are irresistibly shareable, and there are plenty of tools out there to help you make them quickly and easily – like Recite, pictured here.
All marketers need actionable insight to make important decisions. As the internet reaches a crescendo of voices all vying for their customers’ short attention span, the need for quality citations and third party industry research becomes even more important to stand out.
Therein lies an opportunity: Companies that create credible surveys, reports and playbooks on a regular basis can become known authorities and trusted resources – ahead of the competition. Such authority leads to trust and in the content marketing world those are essential characteristics to attract a target audience whether they are buyers, journalists or investors.
Ironically, it’s this exact labor-intensive exercise that provides some of the most sharable, citable content. The ability to attract substantial citations, social shares and attention is a very powerful capability for agencies and corporate marketing marketing departments to have right now.
To benefit from this opportunity, it takes the hard work of doing thoughtful research. Once you’ve invested in conducting original, topically relevant research through polls and surveys, the task of making your findings part of the content marketing mix is only a matter of breaking it down into digestible bites, customized to the people you’re trying to connect with.
Every industry has their data champions whose purpose is to explain what’s happening in your world. Industry Analyst and Research Organizations like these devote a good portion of their marketing efforts on providing industry trends and offering insights and advice to illuminate what’s in demand within a market now and in the future:
Whether you’re a non-partisan, public opinion poll, a B2B company wanting to demonstrate thought leadership within the business community or a B2C brand using research to gain a foothold in a new market, the data you collect and research you conduct represent a solid foundation for a plethora of the content marketing tactics.
For example, research was recently published by The Corporate Executive Board Company and LinkedIn (a TopRank client) that identified how marketers’ content skills, in particular, need to evolve, providing any number of content bites for practitioner’s in the field.
The Interactive Advertising Bureau (IAB) has an entire section devoted to industry research available to its members that can inspire companies to conduct their own research or repurpose the research they find that relates to their audience.
When done right, you could gorge on a content feast for the next six months with the data and analysis revealed from this type research.
Pros
Can become a revenue stream for your agency or business (MarketingProfs, eConsultancy)
Established thought leadership in a crowded market (Gartner, Pew Research, HubSpot)
Leverage research to drive customers and prospects to real-world events (Content Marketing World, MarketingProfs B2B Forum)
Tacit endorsement for industry practitioners when compiled by impartial third parties (CMI, GigaOM)
You can quantify meaningful engagement from your market research (Hubspot)
Providing strategic industry research consistently builds your reputation, trustworthiness and, ultimately, your bottom line (CEB)
Cons
Qualitative research takes unique skills and resources
Direct line of sight ROI with research is not as likely compared to other content marketing metrics
Initial research efforts, without history, may not be perceived as credible. It can take multiple reports to gain momentum.
Your research is only as good as your premise. If your premise if flawed, your research could prove useless.
What the Marketing Experts Are Saying
“The biggest opportunity corporate researchers have is to make sure our voices are heard within the organization. Not all organizations have ‘bought in’ to research and what it can do to save time, money and resources for the future growth of a company. Researchers who know how to demonstrate this value, while also selling what they do to gain buy-in from the top down, have the greatest opportunity.” Kassandra Barnes, Research & Content Manager, CareerBuilder
“RockYou® is investing in the development of the social gaming landscape and its growth as a powerful advertising medium. This study enables us to better understand social gamers and their motivations and provide advertisers, agencies, and social game developers with actionable information they can leverage in a rapidly evolving social economy.” Julie Shumaker, SVP and GM of Media
Examples: Slide Deck, eBook, White Paper
Blackbaud & Content Marketing Institute
The Content Marketing Institute (CMI) and Blackbaud have released the findings from a first-time study that shows how nonprofit professionals in North America approach content marketing.
Getting it Right
Piggybacking on the highly successful B2C and B2B benchmarking surveys CMI has previously conducted
Research on how nonprofits distribute content helps justify their content marketing efforts
Accompanied by a compelling Infographic created by Blackbaud, making the research eminently shareable across social platforms
Offered in both PDF and slide deck creative for diverse consumer consumption
Kapost
Kapost, a content marketing software platform, developed a 41-page eBook targeted at marketers. Surprise!
Getting it Right
Examines the new buyer’s journey and marketing’s new role
Creative execution with its comic book theme, giving readers a unique reason to share
Provides a side-by-side comparison of old-school vs. content-powered marketing
Suveryed content marketing industry experts, such as Joe Pulizzi (Content Marketing Institute), Joe Chernov (Kinvey), Barabara Saxby (Accelent Consulting), Todd Wheatland (Kelly OCG) to derive recommended next steps
Jive
Social business solutions technology provider, Jive, partnered with GigOm, a new type of media company, to identify how HR can embrace social business despite a distributed enterprise workforce.
Getting it Right
White paper explores the current state of the workforce
Partnering with independent third party, GigaOM Research, lends credibility to the research
Presenting research on social technology investments for HR give a reason to share the data across social platforms.
Guidelines for Conducting Customer Surveys & Research for Content Marketing
For the purposes of our online marketing audience, the following guidelines apply to conducting electronic surveys only.
Conduct preliminary research – With automated survey software you can create multiple surveys to gather information. Start with questions that will give you actionable information. Your goals will determine what those questions should be.
Determine your target audience – Customize your survey for your target group. If you’ve been segmenting your email list based on the minimum customer profile of existing, potential and leads. The language and tone may vary depending on where someone is in the customer life cycle.
Keep the questions simple – Use simple straightforward language and keep them as short as possible. Avoid asking two pieces of information in one question, e.g. cost and quality. Break it into two shore simple questions, leading to better data.
Prioritize question order – Start with personal questions that the respondent would most likely respond to from their own experience and work your way toward least-personalized questions once the respondent has warmed up.
Use ample white space – If you’re using free online survey software, pay particular attention to the layout. Ideally, you want a survey that presents each question on its own individual page, taking advantage of the white space. It helps to have a progress bar, so respondents know where they are in the process and don’t feel overwhelmed by a long list of questions.
Be transparent – Be honest with exactly how long the survey will take. I’ve exited out of surveys when I saw that the progress bar didn’t match my expectation for time allotted.
Test before sending – Obviously, you want to check for spelling and grammar errors, but testing different email platforms is important as well. Send a survey to a small sample of your target audience. Feedback from the testers can provide invaluable insight, such as confusing questions illogical order and so on.
For a more detailed understanding of internet methodology, please see Conducting Research on the Internet: Online Survey Design, Development and Implementation Guidelines at ResearchGate.net.
Does your organization use surveys or conduct research to create more insightful content for your audience?


 All marketers need actionable insight to make important decisions. As the internet reaches a crescendo of voices all vying for their customers’ short attention span, the need for quality citations and third party industry research becomes even more important to stand out.
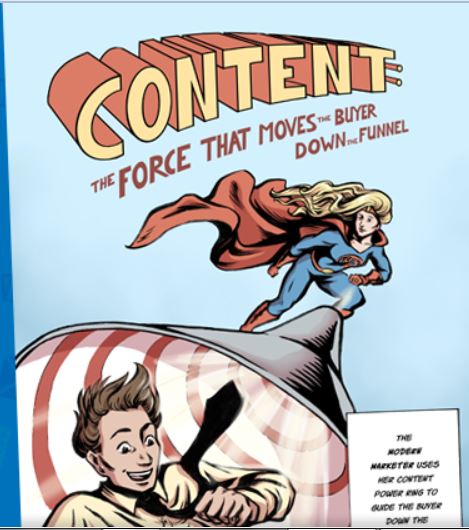

You must be logged in to post a comment.