Trulia Crime Map helps you find safe living places
Real estate site Trulia made a great move when they acquired mapping outfit Movity late last year to help users make informed decisions in home buying. A month ago, they launched a price reductions map to let you see how housing prices were changing. Now you can see what crime is like in that area you’re thinking about living in with Crime Map.
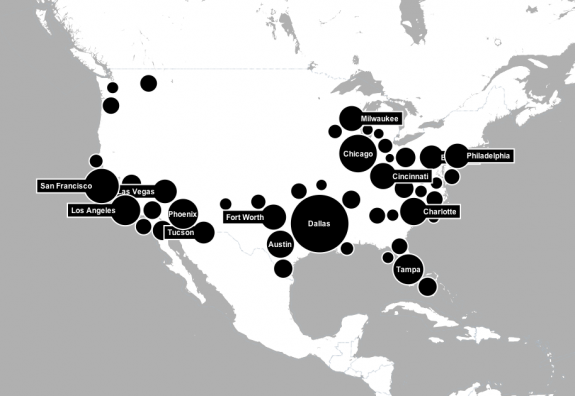
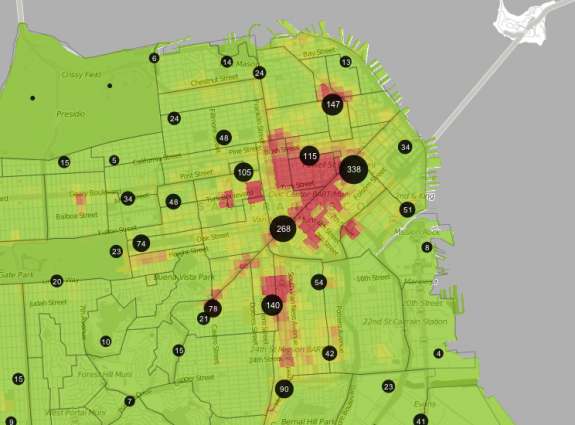
Drawing from three data sources, CrimeReports, EveryBlock, and SpotCrime, Crime Map starts with a national view (as shown below) for cities with available data, and then zooms into specific areas. The above, for example, is a view of San Francisco. As you’d guess, the darker red areas and larger circles indicate more incidents, whereas green areas and smaller circles represent the opposite. Click on regions or the scaled circles to see details on individual crimes during the past year.

This is good stuff already, but there are a few things that take Crime Map to the next level. The first is that Polymaps, a JavaScript library for vector maps, was used. I don’t have anything against Flash, but it’s cool to see how well the alternative does. The differences between Flash and JavaScript-based maps are barely discernable nowadays.
And then there’s the little things like permalinks for locations, filtering by crime type, quick zooms to locations with the most crime, and discussion pages. It’s that little bit of awesome sauce that makes for an extra informative application.
[Crime Map via @shashashasha]
